


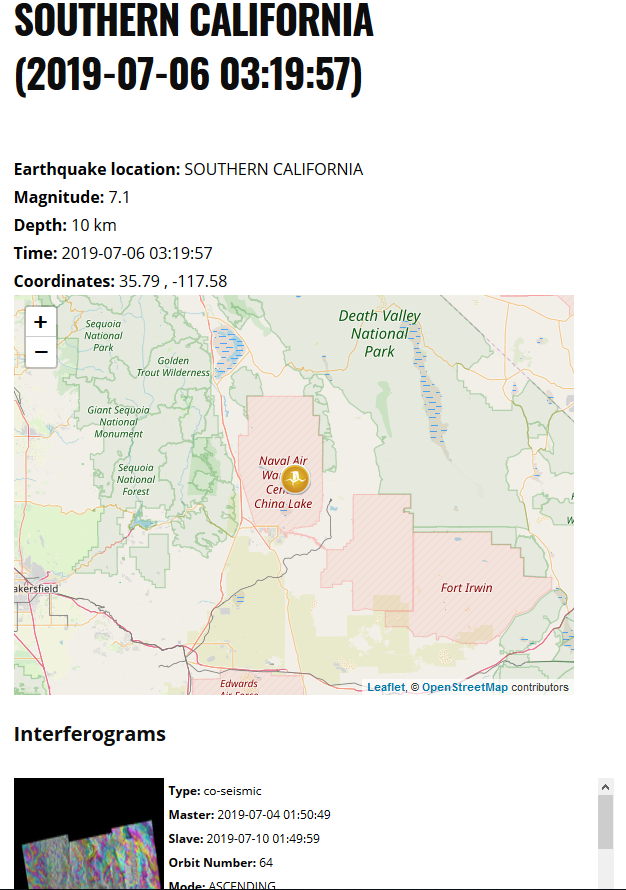
The 2019 Ridgecrest earthquakes of July 4th and 5th occurred north and northwest of the town of Ridgecrest, California [2] (approximately 200 km north-northeast of Los Angeles), and included three main shocks of Mw [3] magnitudes 6.4, 5.4, and 7.1.
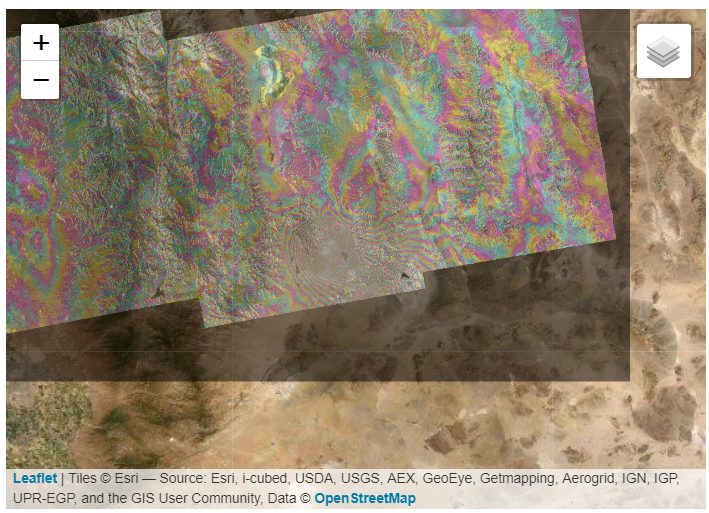
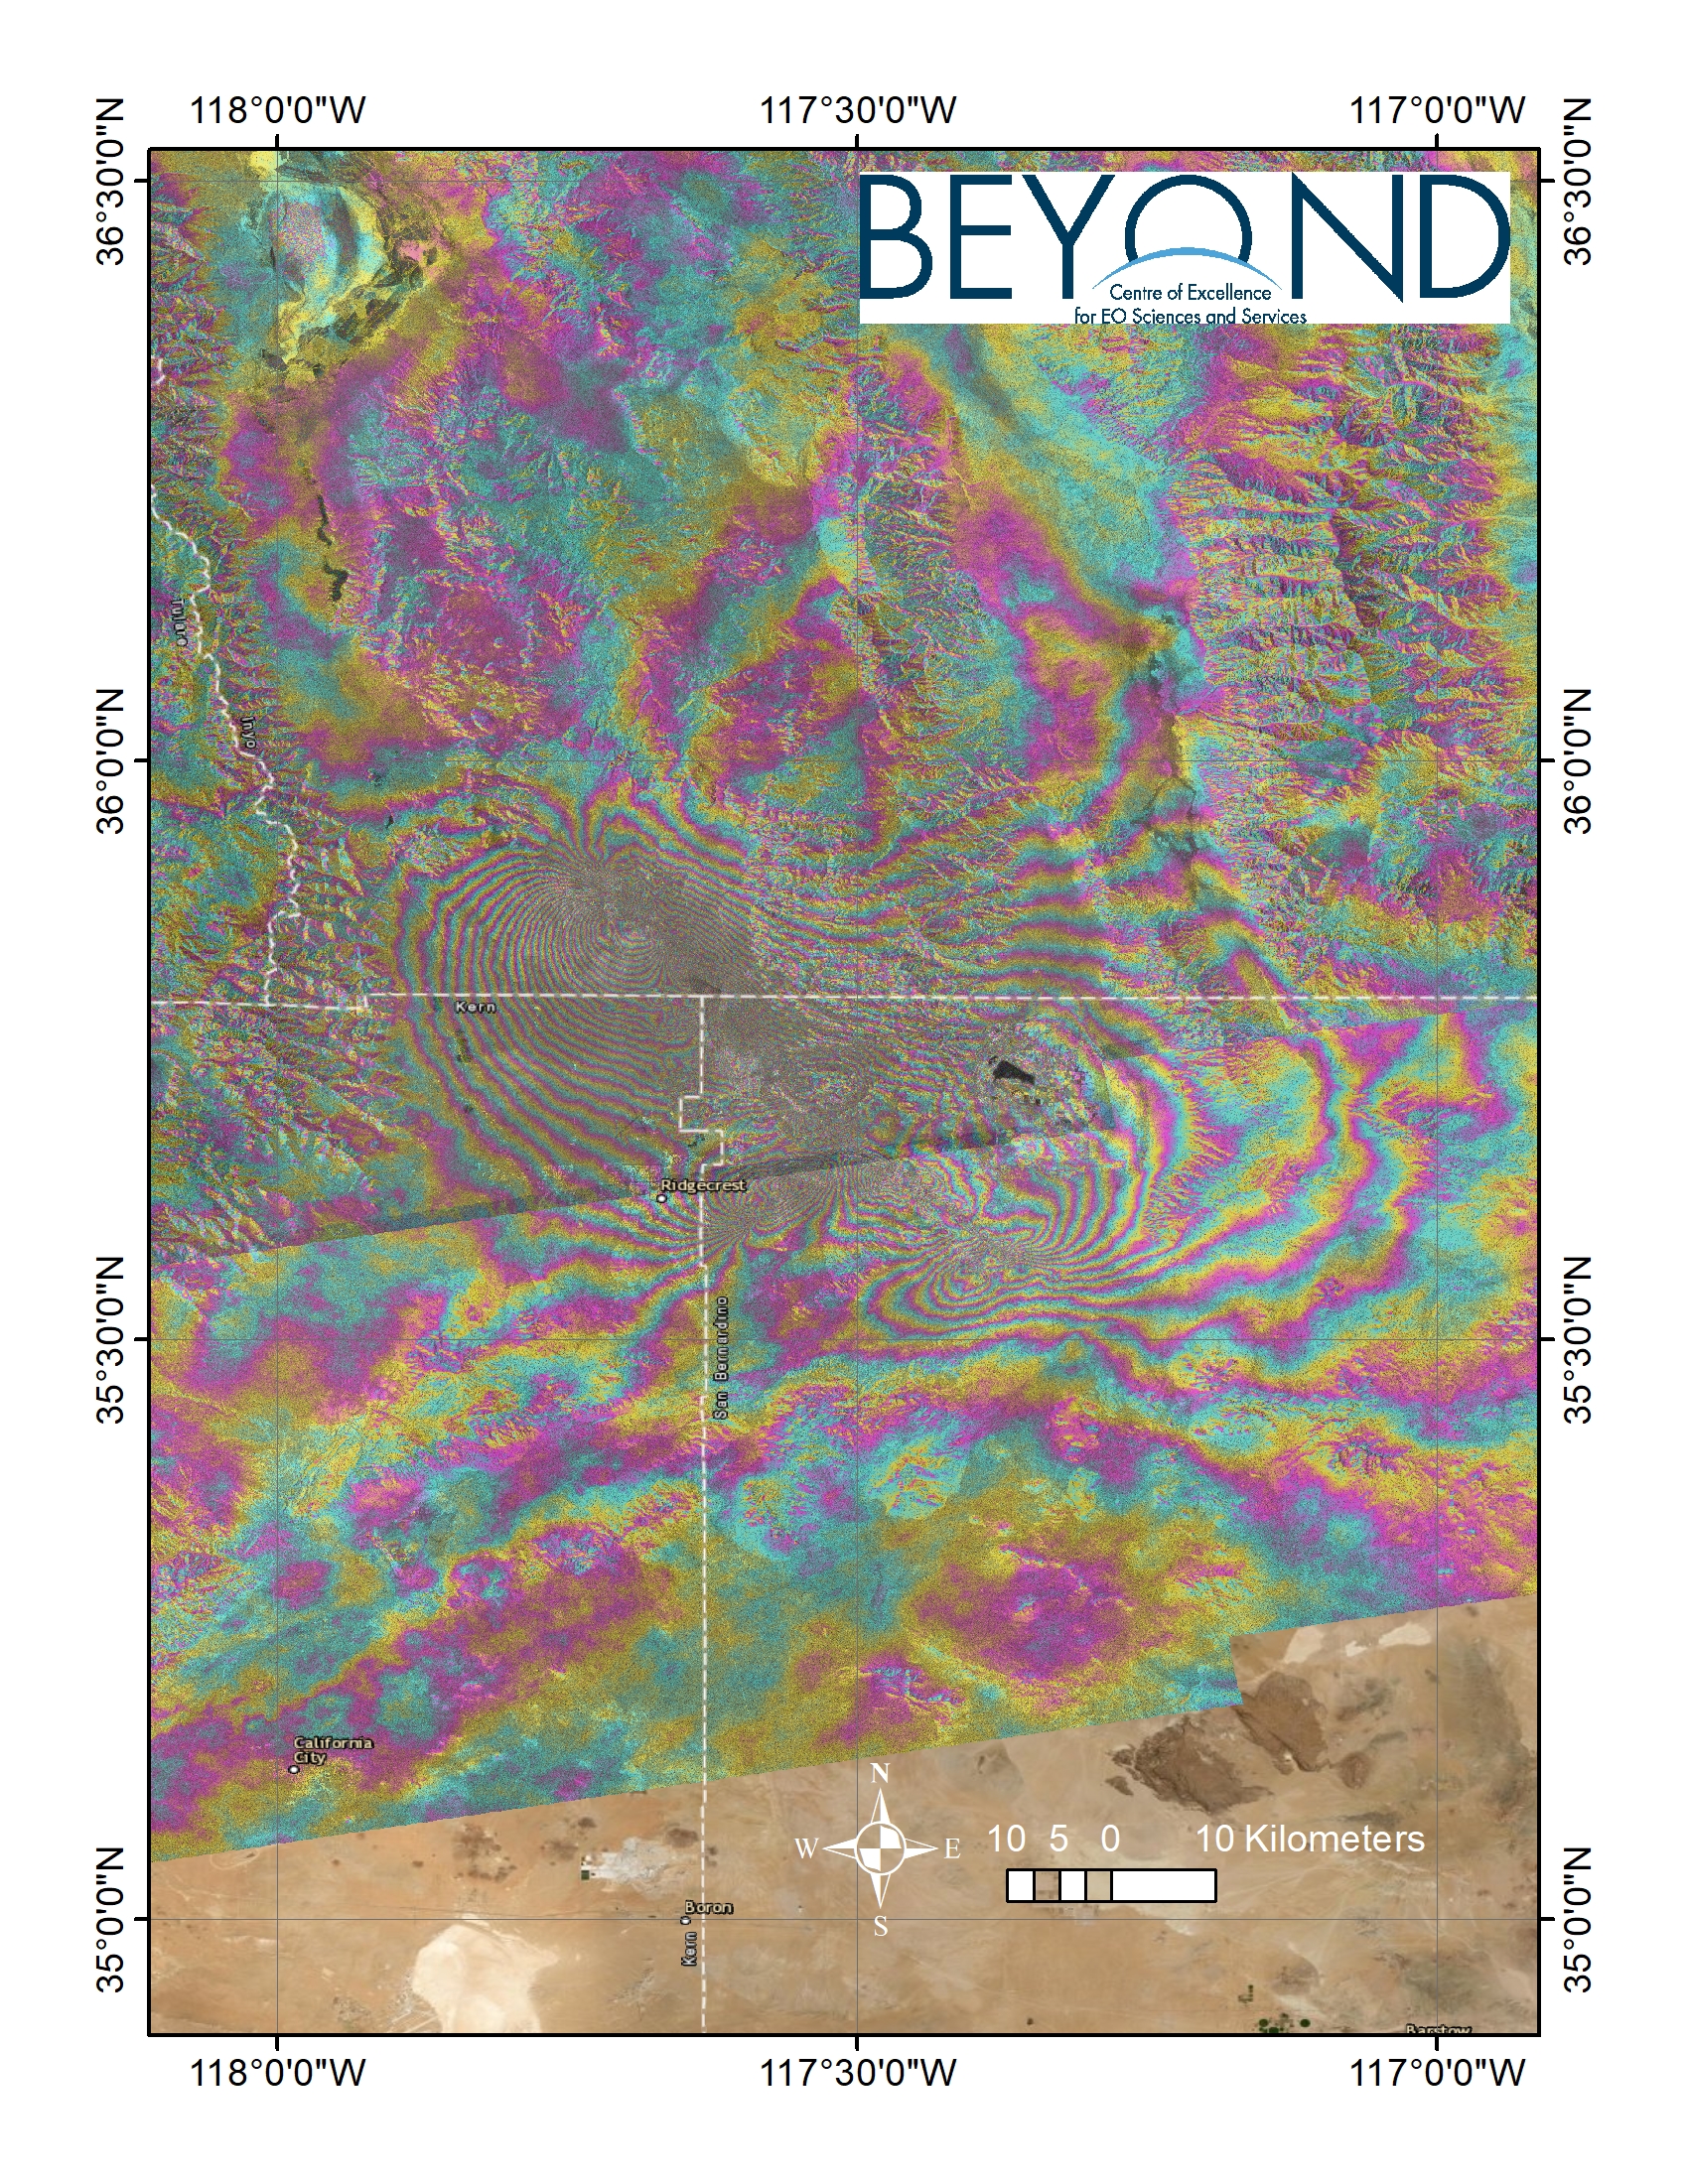
Our geObservatory online platform (https://bit.ly/2XFesPR) grants download and visualization access to all the latest pre- and co-seismic
Sentinel-1 interferograms covering these recent #RIDGECREST [1] earthquakes. A dense fringe pattern is observed in an ascending interferogram produced from a data pair acquired on 4th of July, just before the earthquakes, and on the 10th of July. This contours pattern corresponds to zones of equal deformation.
geObservatory is an operational application for the timely mapping of ground deformation. geObservatory is activated in major geohazard events, such as earthquakes, volcanic activity, landslides, etc. and automatically produces a series of
Sentinel-1 based co-event differential interferograms to map the surface deformation associated with the event. The role of geObservatory is
twofold: firstly, it provides to emergency management authorities with a rapid assessment of ground deformation, secondly it produces and maintains a global observatory of differential interferograms associated with catastrophic geo-events, which can potentially populate a tailored Data Cube to allow further processing and analytics.
Links:
------
[1] https://twitter.com/hashtag/Ridgecrest?src=hash
[2] https://en.wikipedia.org/wiki/Ridgecrest,_California
[3] https://en.wikipedia.org/wiki/Seismic_magnitude_scales#Mw